Onchain research for the trenches.
Free tools built on the wallets we read every day, across Robinhood Chain, Solana, Ethereum, Base and BNB Chain.


Every tool and piece we've released.
New ones join this list.
Every coin ranked each morning by how its holders behave: conviction, demand, market health and relative strength, combined into one score.
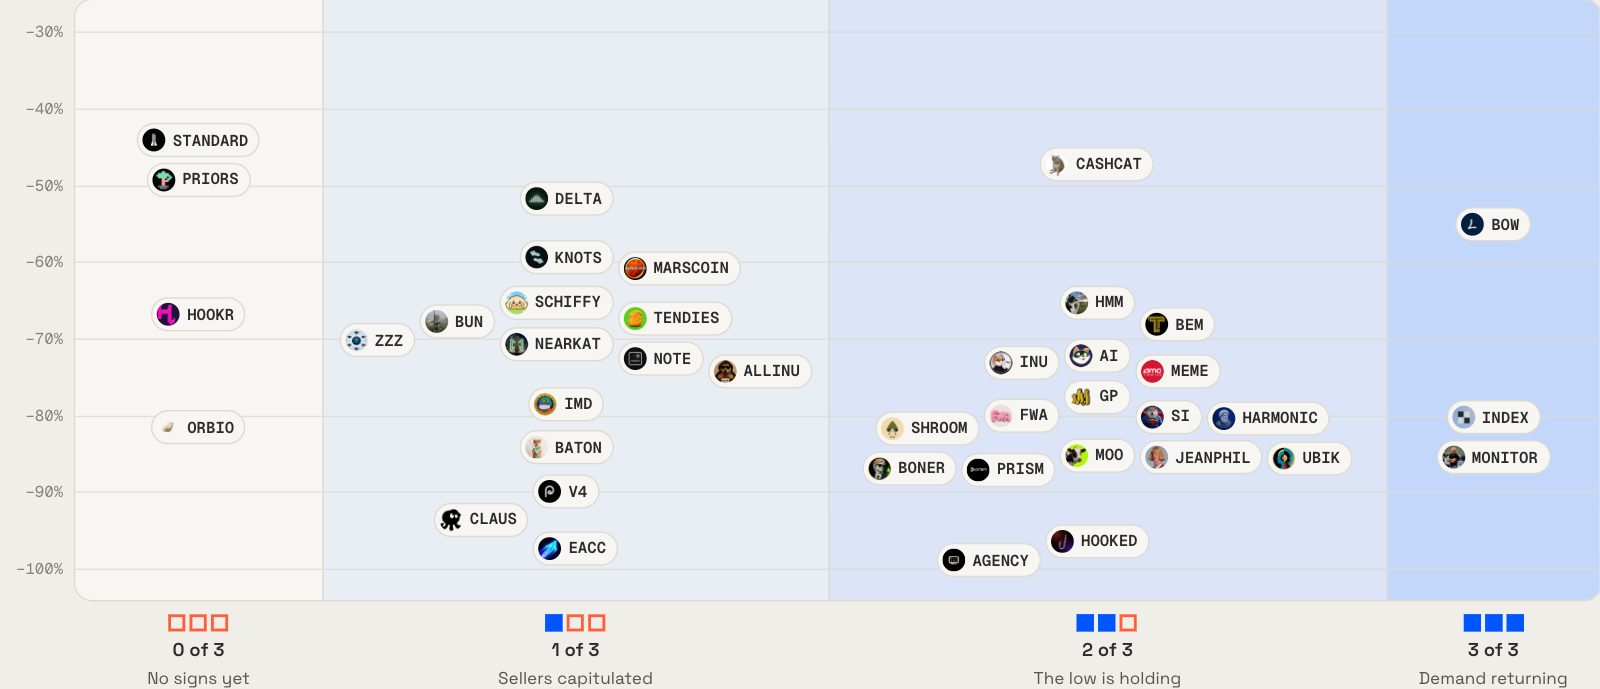
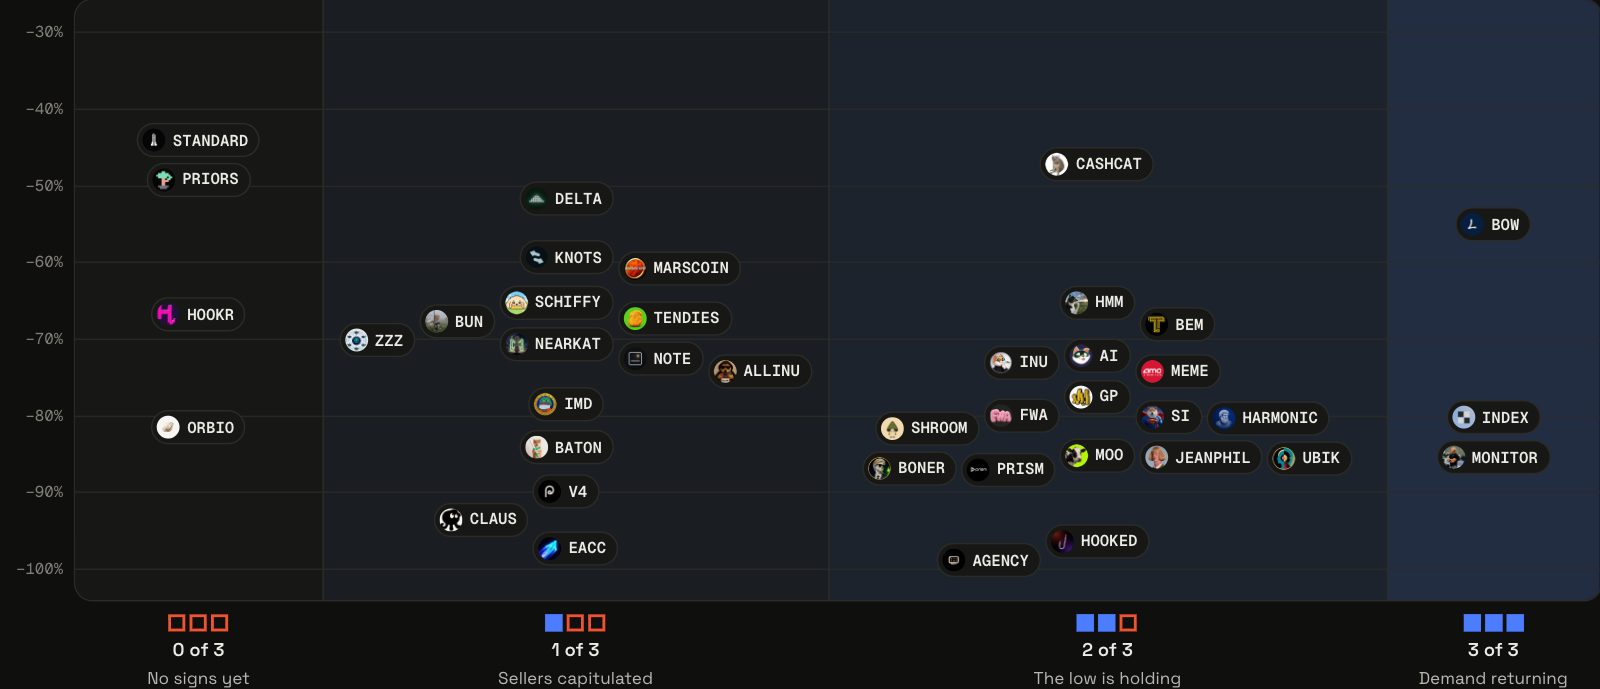
After a fall, three onchain signs read in order: sellers capitulate, the low holds, demand returns. The map shows how far each coin has come.
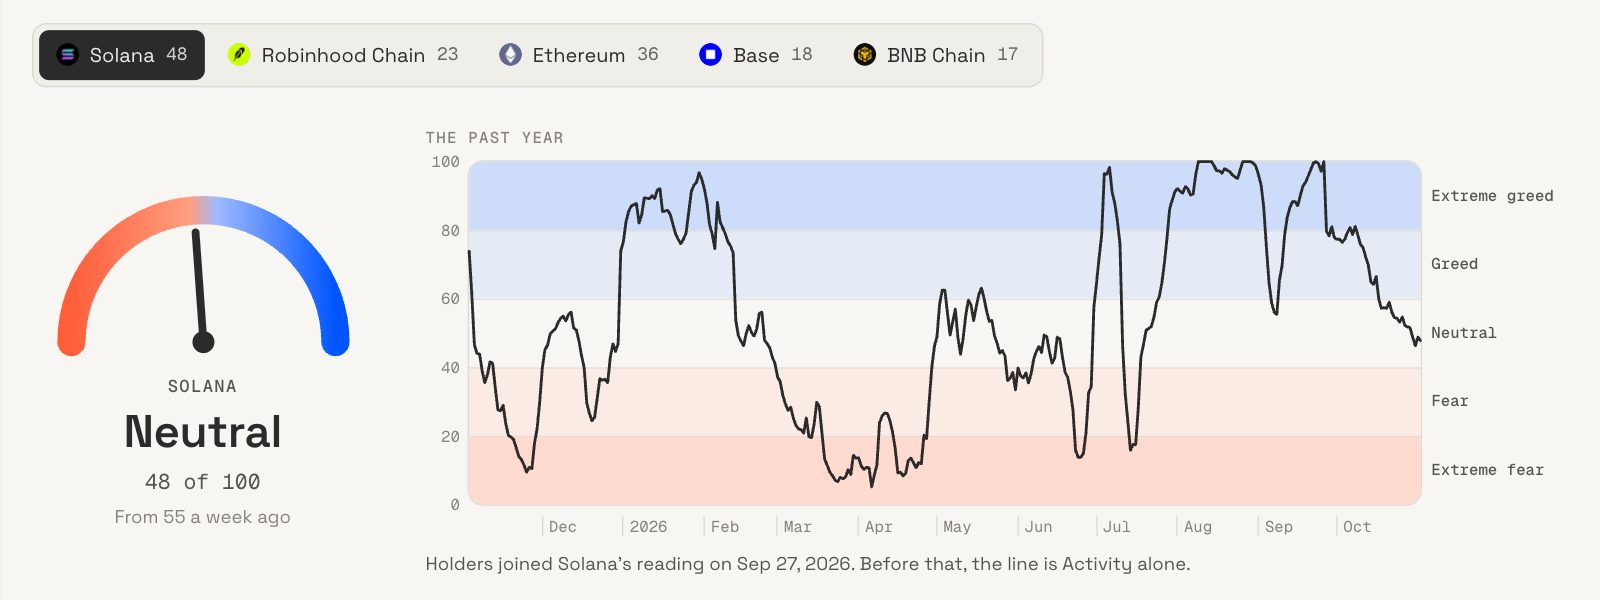
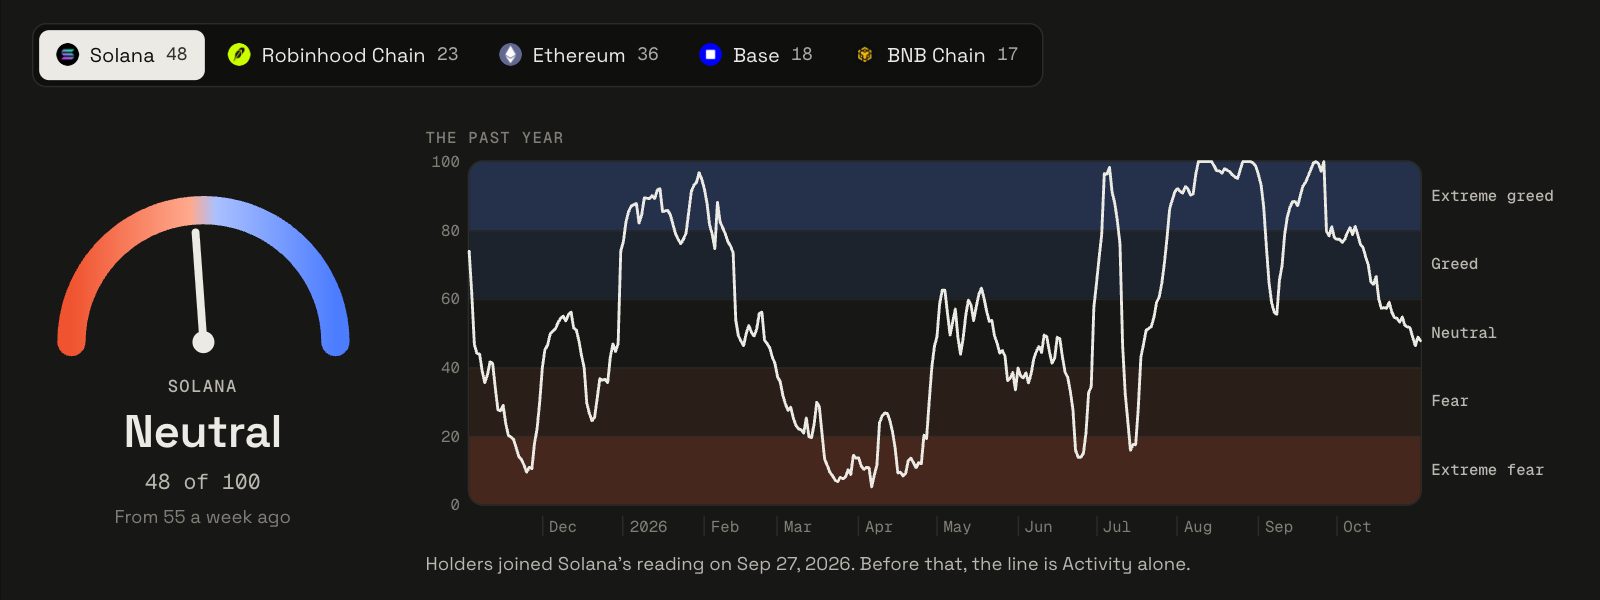
How fearful or greedy the meme market is on Solana, Robinhood Chain, Ethereum, Base and BNB Chain, from 0 to 100, each chain with its own reading. Read onchain from launchpads, trading bots and holders.
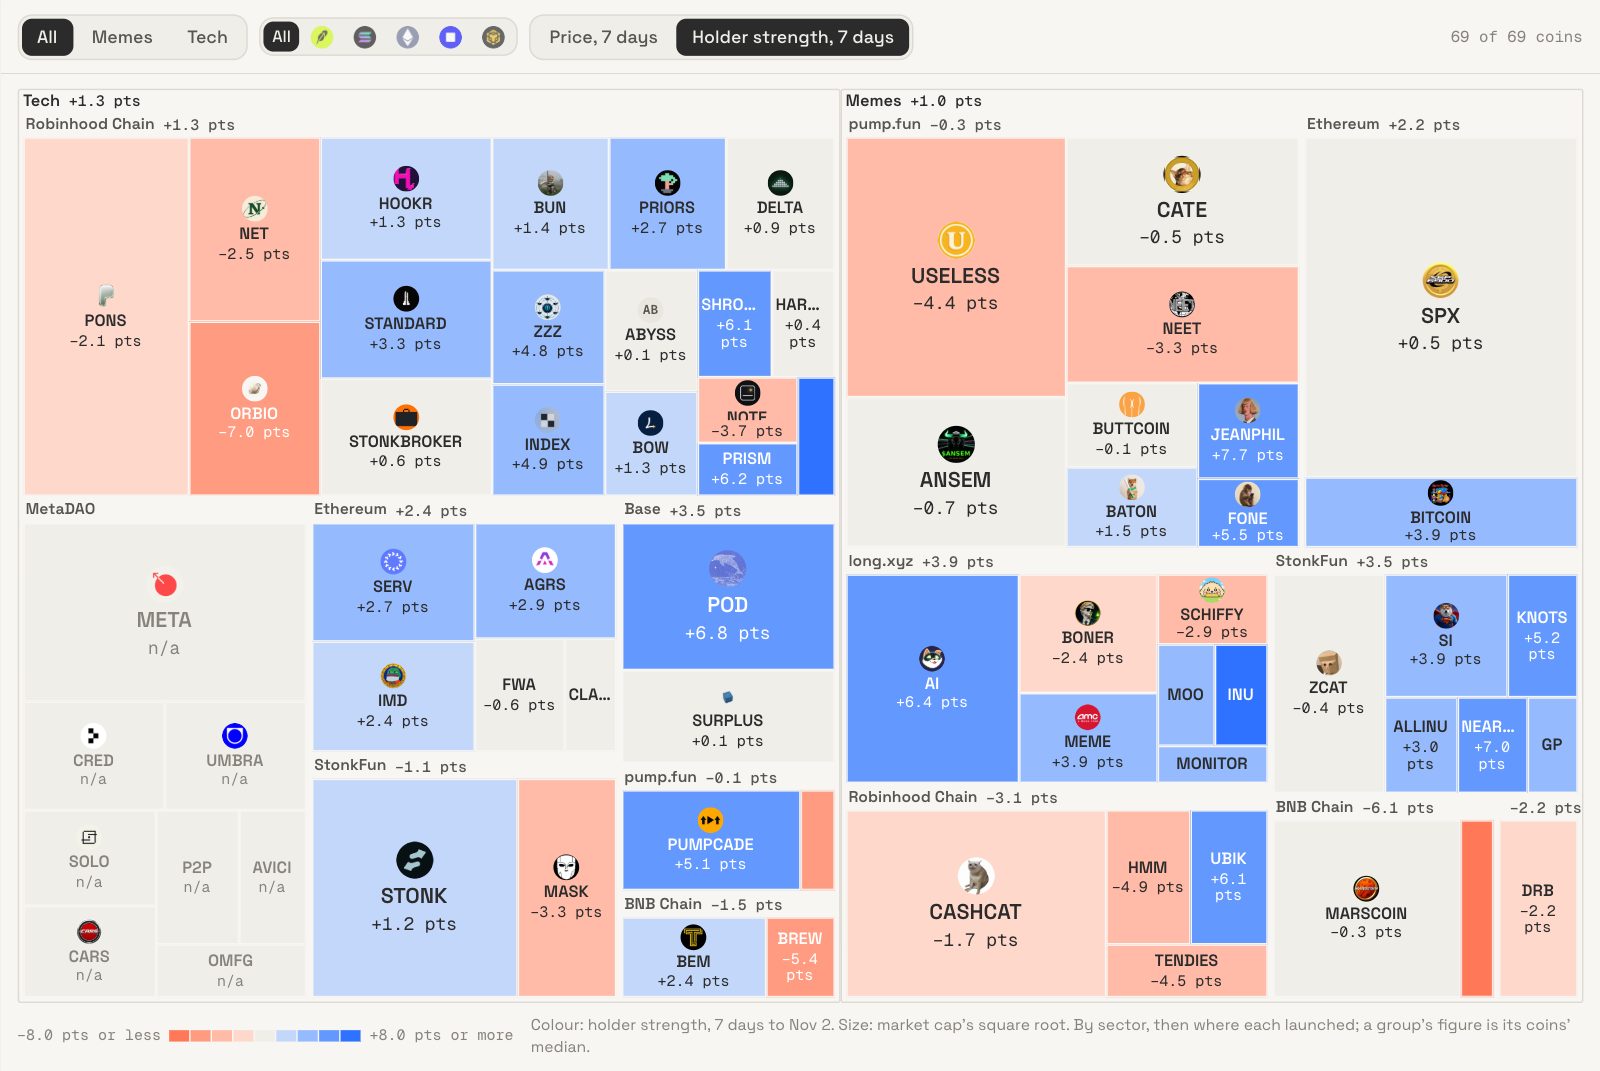
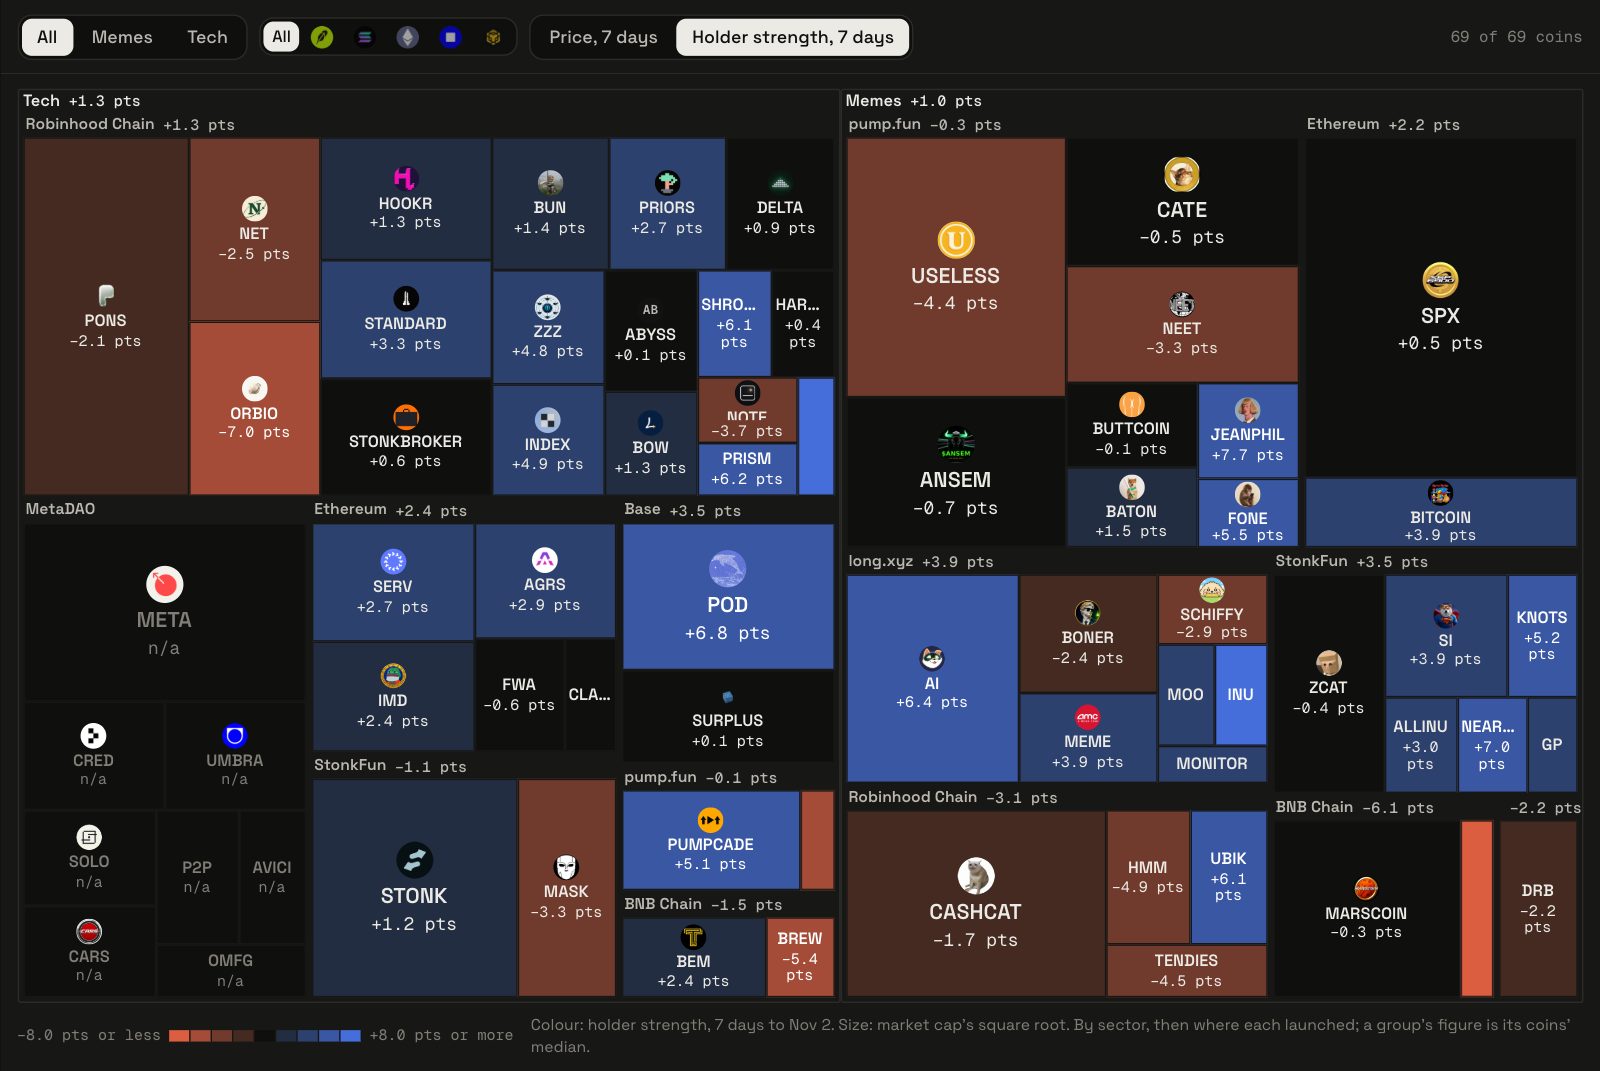
Every coin in the index as a tile, grouped by sector and where it launched: its size is its market cap, its colour how far its price, or its holder strength, moved over the week.
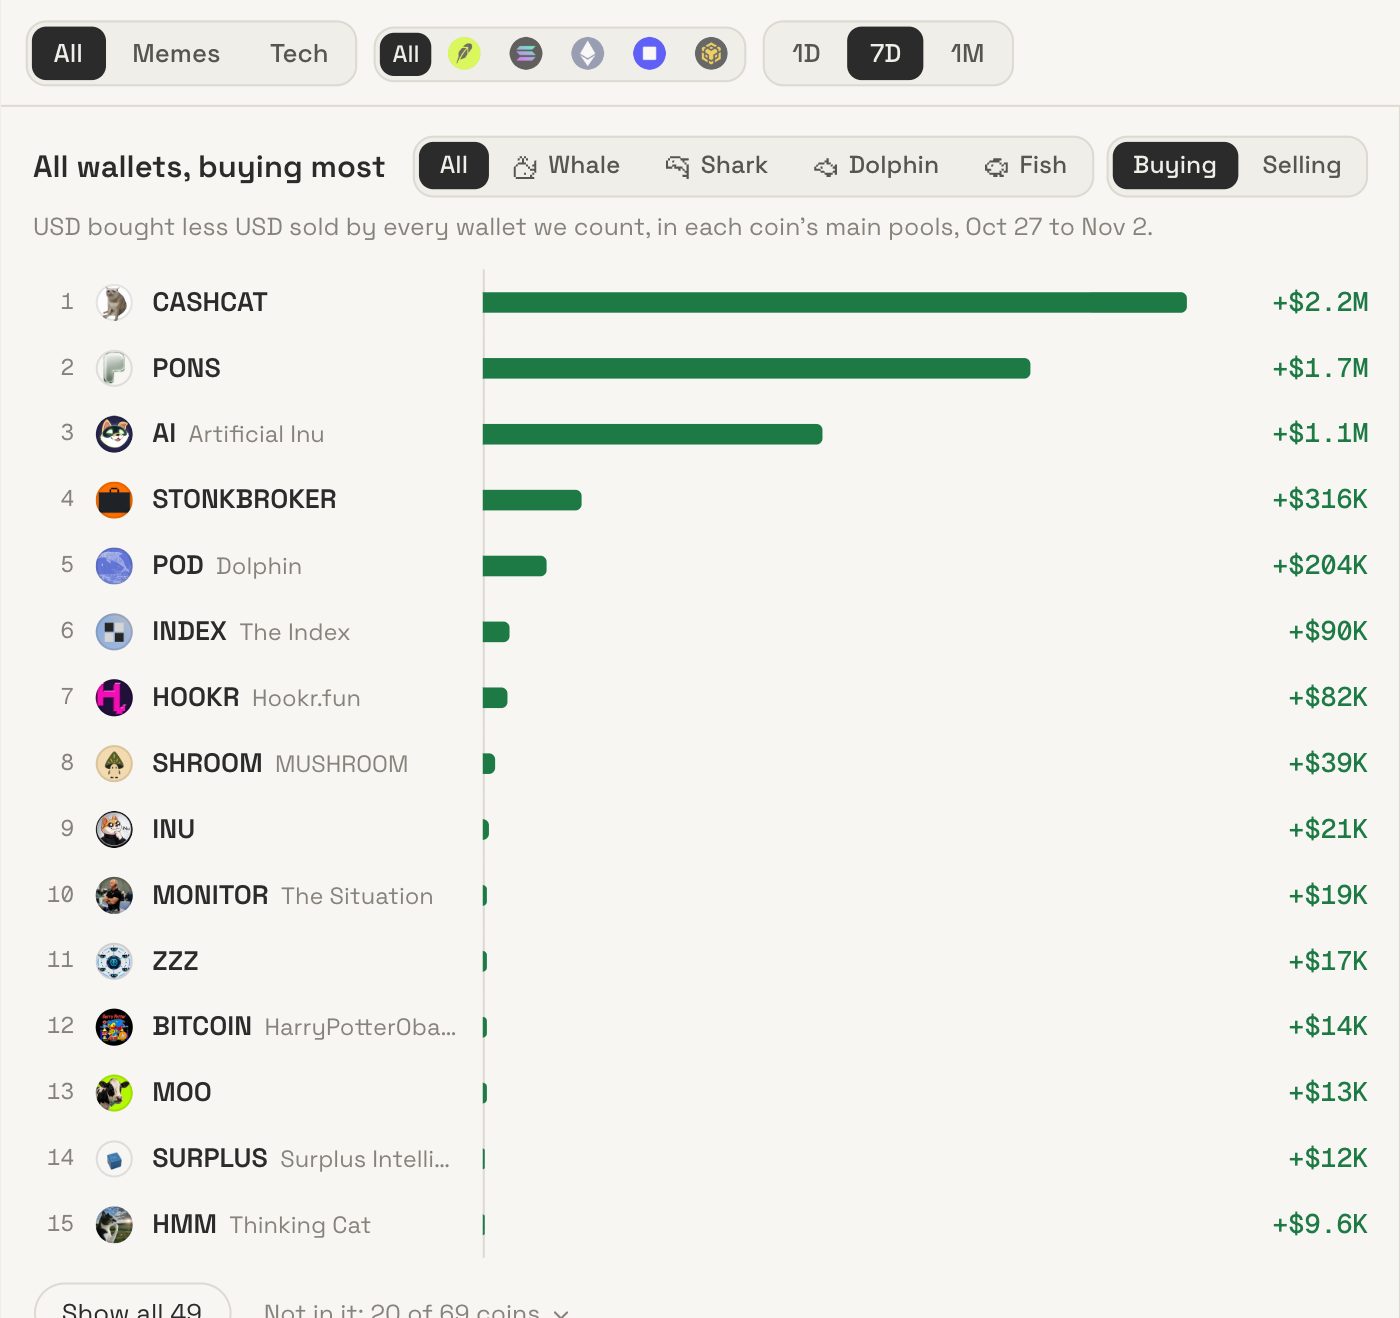
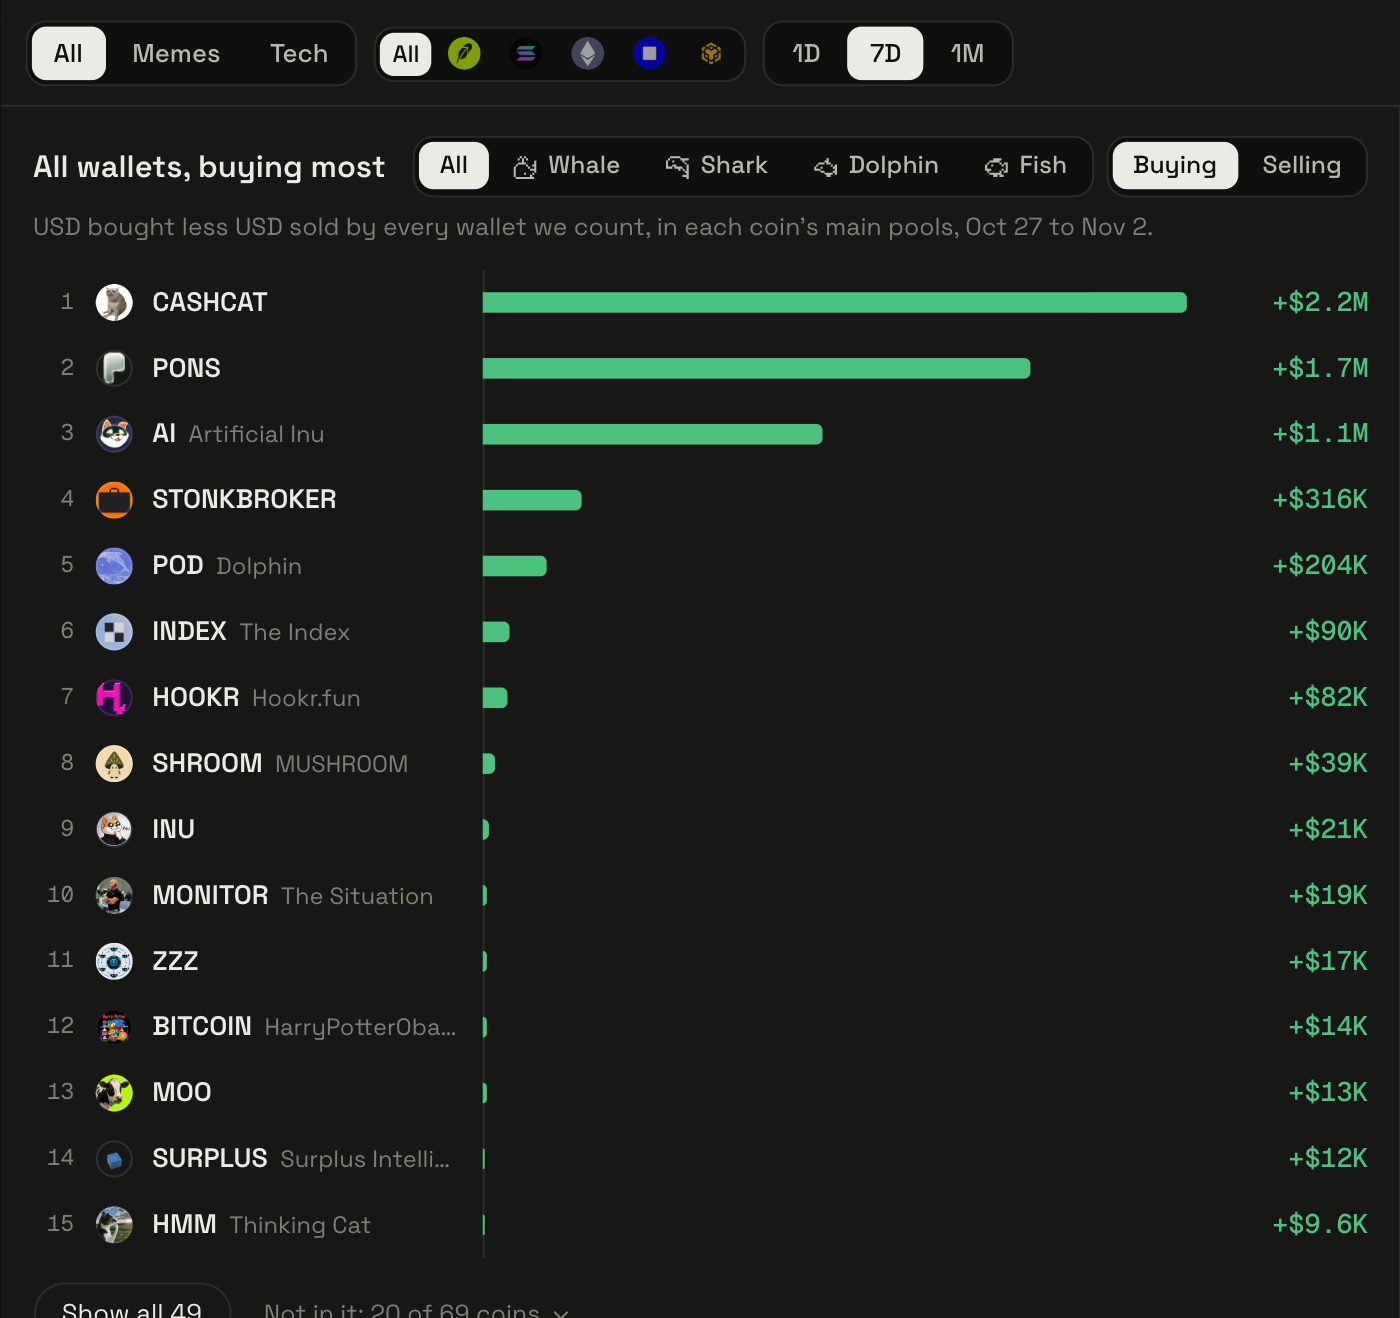
Who's buying and selling the coins in the index: all wallets together, and by how much they hold, from whales to fish. Dollars bought less dollars sold, by day and by week.
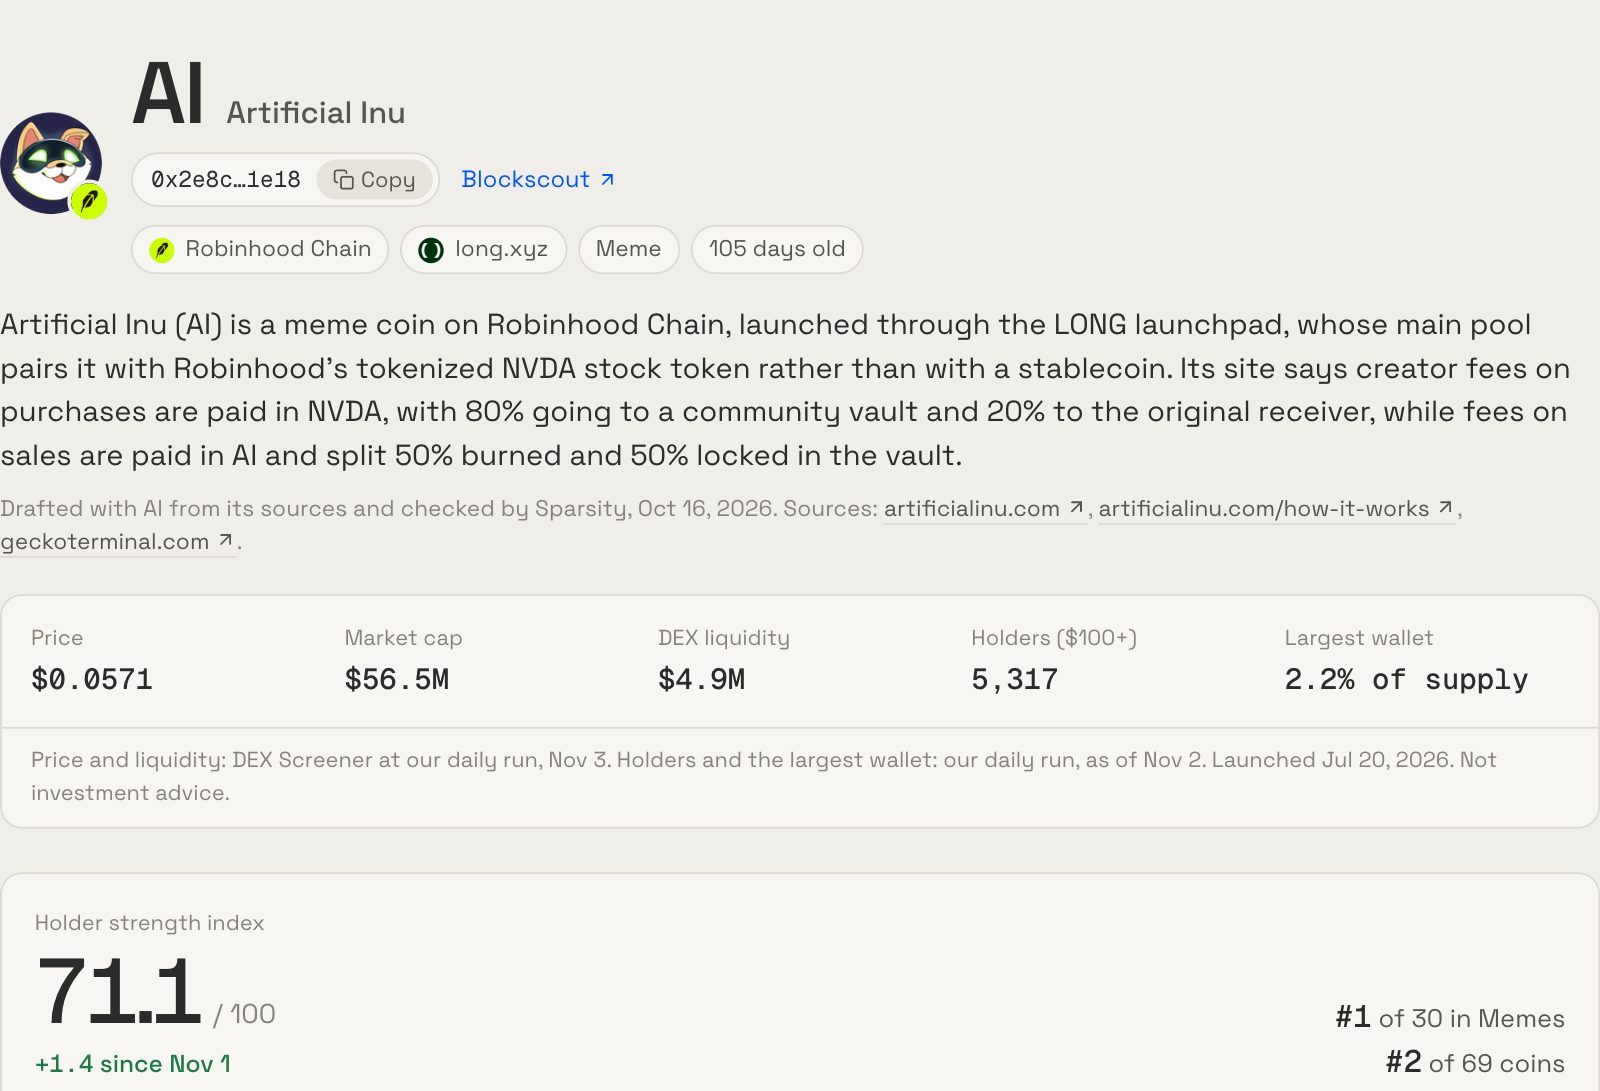
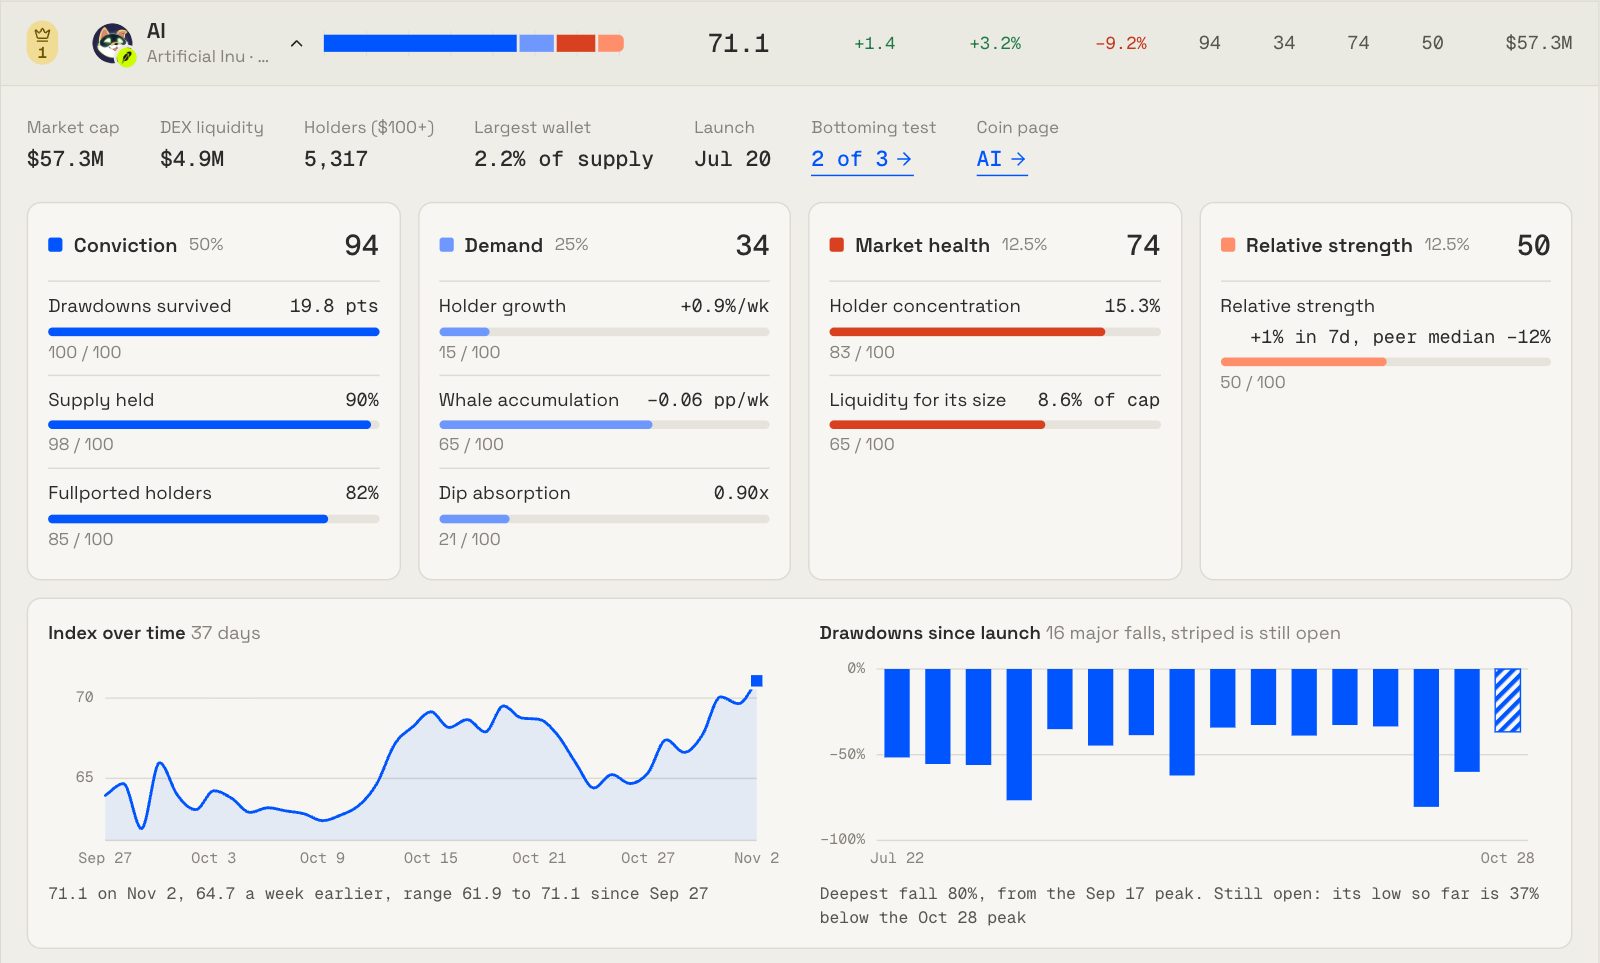
One page per coin: its score and rank, its four areas and the metrics behind them, its bottom signs, its drawdowns, its peers and what the project is.
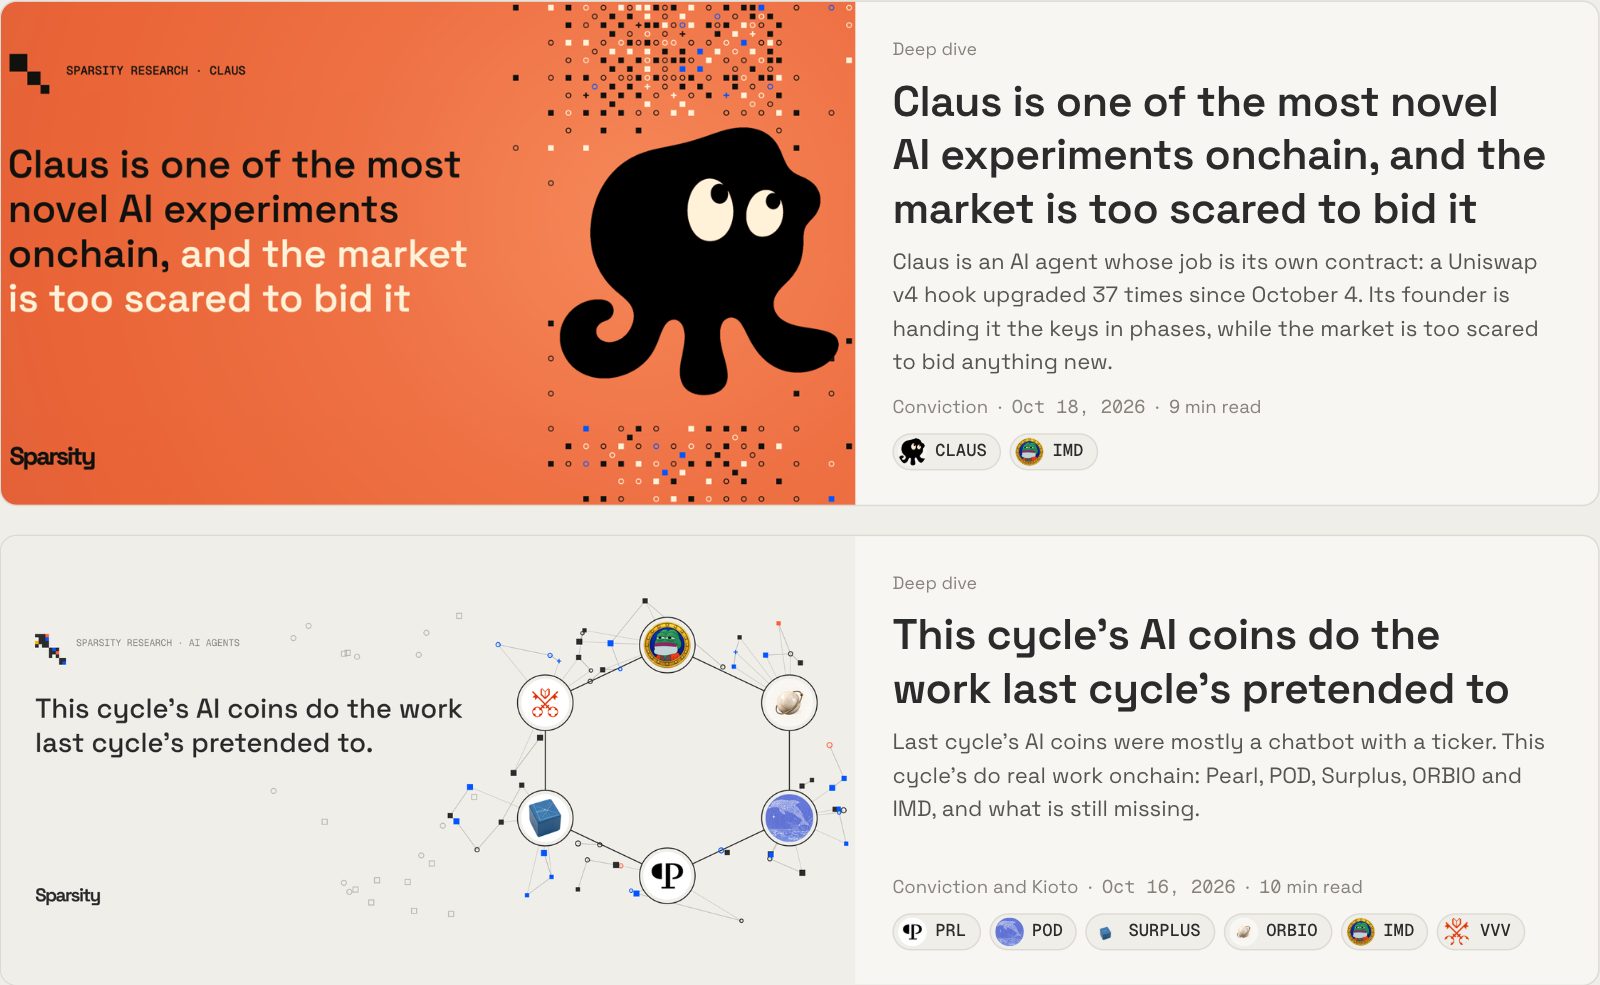
Pieces on the coins and ideas we track, with a source for every claim, each one free to read in full.